|
|
|
|
|
|
1.
|
Study the information above.
What do you expect to learn from this module? Enter your answer on the right. Also, review the
vocabulary words and look for them as you work through this lesson. You will be tested on them
later.
|
|
|
Economists say that a market will tend
toward equilibrium, which means that
the
price and quantity will gradually move
toward their equilibrium levels. Why does
this happen?
Remember that excess
demand will lead firms to raise prices.
Higher prices induce the quantity
supplied
to rise and the quantity demanded to fall
until the two values are equal.
On
the other hand, excess supply will
force firms to cut prices. Falling prices will
cause
quantity demanded to rise and
quantity supplied to fall until, once again,
they are equal.
Through these relationships,
the market price and quantity sold
of a good will move toward
their equilibrium
values.
|
Remember from Chapters 4 and 5 that
all of the
changes in demand and supply
described above are changes along a
demand or supply curve.
Assuming that a
market starts at equilibrium, there are two
factors that can push it into
disequilibrium:
a shift in the entire demand curve
and a shift in the entire supply
curve
 | | |
|
|
|
2.
|
What do companies do when there is excess demand for a
product?
a. | lower
prices | c. | nothing | b. | raise prices | d. | change the product |
|
|
|
3.
|
What happens to the supply of a
product when prices rise?
a. | The company will produce more of the
product, supply will increase | c. | The company will do nothing | b. | The company will produce less of the product, supply will
decrease | d. | The company will reduce
prices |
|
|
|
4.
|
What happens when the quantity
of a product increases along with an increase in prices?
a. | demand for the product will
increase | c. | there will be no
change in supply or demand | b. | demand for the product will decrease | d. | prices will rise even more |
|
|
|
5.
|
What happens to the market when
the supply for a product equals the demand for the product?
a. | the market is in
disequilibrium | c. | the market is
falling | b. | the market is in equilibrium | d. | the market is rising |
|
|
|
| Factors that reduce supply shift the supply curve to the
left, while factors that increase supply move the supply curve to the
right. | Changes in
Price
In Chapter 5, you
read about the different
factors that shift a supply curve to the left
or to the right. These
factors include
advances in technology, new government
taxes and subsidies, and changes in
the
prices of the raw materials and labor used
to produce the
good.
| Since market
equilibrium occurs at the
intersection of a demand curve and a
supply curve, a shift of the
entire supply
curve will change the equilibrium price and
quantity. A shift in the supply curve
to the
left or the right creates a new equilibrium.
Since markets tend toward equilibrium,
a
change in supply will set market forces into
motion that lead the market to this
new
equilibrium price and quantity sold. | | |
|
|
|
6.
|
Where does market equilibrium
occur in a chart?
a. | The lowest point on the demand and
supply curve | c. | The highest point
on the supply curve | b. | The highest point on the demand curve | d. | The point at which the supply curve and the demand curve
cross |
|
|
|
7.
|
What can cause a change in the
price of a product? (select all that apply)
|
|
|
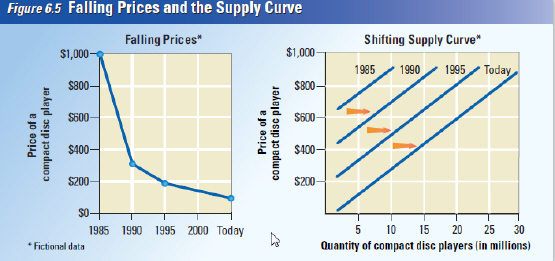
As CD players become cheaper to produce, the supply increases at all
but the lowest prices. | Understanding a Shift in Supply
When compact disc players were first introduced in the
early 1980s, a basic, single-disc machine cost around $1,000. The early compact disc players were
much more expensive and less sophisticated than the compact disc players people use today. Gradually,
as firms developed better technology for producing compact disc players, their prices fell. In 1990,
a consumer could purchase a fancy single-disc player for $300; just five years later, in 1995, a
similar player could be purchased for about $200. Today, consumers can buy a compact disc player for
less than $100.
Not only have the prices of compact disc players fallen, but the machines on
sale today have many more features and options than the original $1,000 machine. .
| Technology has
lowered the cost of manufacturing compact disc players and has also reduced the costs of some of the
inputs, like computer chips. These advances in production have allowed manufacturers to produce
compact disc players at lower costs. Producers have passed on these lower costs to consumers in
the form of lower market prices
We can use the tools developed in Chapter 5 to graph the
effect of these changes on the CD market? ’s supply curve. Figure 6.5 shows how the supply
curve shifted outward, or to the right, as manufacturers offered more and more CD players at lower
prices. In the early 1980s, no compact disc players were offered for $300. They were simply too
expensive to develop and manufacture. Today, manufacturers can offer millions of CD players at this
price. | | |
|
|
|
8.
|
What factor is most important
in reducing the cost and quality of CD players through the years.
a. | More people are listening to music
than before | c. | Technology has
reduced the cost and improved the quality of CD Players | b. | Hip Hop and Rap are better music than classical
music | d. | More people can afford CD
Players |
|
|
|
9.
|
Technology has reduced the cost
of CD players by lowering the cost of manufacturing. What other factor has technology helped to
reduce cost?
a. | component
parts | c. | marketing in multiple outlets such
as Costco | b. | advertising the product | d. | the popularity of country/western
music |
|
|
|
10.
|
Normally demand will influence
the supply of a product until an equilibrium point is reached between supply and demand. What happens
to the supply curve if an outside force, such as technology, influences both supply and demand
causing them both to increase?
a. | the demand and supply curve will
shift to the left | c. | supply will
decrease | b. | the demand and supply curve will shift to the
right | d. | demand will decrease while supply
increases |
|
|
|
Finding a
New Equilibrium
Picture
the point in time when compact disc players were evolving from an expensive luxury good to a
mid-priced good. A new generation of computer chips has just reduced the cost of production. These
lower costs have shifted the supply curve to the right where at each price, producers are willing to
supply a larger quantity.
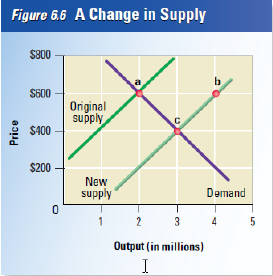
This shift, shown in Figure 6.6 using fictional quantities, has
thrown the market into disequilibrium. At the old equilibrium price, suppliers are now willing to
offer 4,000,000 compact disc players, up from 2,000,000.
In Figure 6.6, the increase in
quantity supplied at the old equilibrium price is shown as the change from point a to point b.
However, the quantity demanded at this price has not changed, and consumers will only buy 2,000,000
compact disc players. At this market price, unsold compact disc players will begin to pile up in the
warehouse. When quantity supplied exceeds quantity demanded at a given price, economists call this a
surplus. The surplus compact disc players are excess supply, so something will have to change
to bring the market to equilibrium.
As you read in Section 1, suppliers will respond to excess
supply by reducing prices. As the price falls from $600 to $400, more consumers decide to buy compact
disc players, and the quantity demanded rises. The combined movement
| of falling
prices and increasing quantity demanded can be seen in Figure 6.6 as a change from point a to
point c. Notice that this change is a movement along the demand curve, not a shift of the entire
demand curve.
Eventually, the price falls to a point where quantity supplied and quantity
demanded are equal, and excess supply is no longer a problem. This new equilibrium point, shown at
point c in Figure 6.6, marks a lower equilibrium price and a higher equilibrium quantity sold than
before the supply curve shifted. This is how equilibrium changes when supply increases, and the
entire supply curve shifts to the right.
 When supply increases, prices fall, and quantity
demanded increases to reach a new equilibrium. When supply increases, prices fall, and quantity
demanded increases to reach a new equilibrium. | | |
|
|
|
11.
|
How do producers react when
production costs have decreased because of technology?
a. | producers decrease the supply
| c. | producers do nothing because of
price instability | b. | producers increase the supply | d. | producers try to avoid the cost of
technology |
|
|
|
12.
|
What do economists call it when
supply exceeds demand?
a. | equilibrium | c. | surplus | b. | shortage | d. | cost |
|
|
|
13.
|
When supply changes from point
a to point b we have a situation called
a. | equilibrium | c. | surplus | b. | excess demand | d. | shortage |
|
|
|
14.
|
What has to happen to the chart
above to reach market equilibrium?
a. | new technology will have to be
introduced to increase supply | c. | the price moves to a point where quantity supplied and quantity demanded are
equal | b. | new technology will have to be avoided | d. | the price falls to a point where quantity supplied and quantity demanded are
equal |
|
|
|
15.
|
Market equilibrium is
illustrated in the chart above by points
a. | a and b | c. | b and c | b. | a and c | d. | equilibrium is not illustrated on this
chart |
|
|
|
16.
|
What happened when the supply
curve shifted from point a to point c?
a. | lower price and greater
supply | c. | increased supply and
price | b. | lower supply but greater price | d. | lower supply and price |
|
|
|
A Fall in
Supply
Just as new
technology or lower costs can shift the supply curve to the right, so other factors that reduce
supply can shift the supply curve to the left. Consider the market for cars. If the price of steel
rises, automobile manufacturers will produce fewer cars at all price levels, and the supply curve
will shift to the left. If auto workers strike for higher wages, and the company must pay more for
labor to build the same number of cars, supply will decrease. If the government imposes a new tax on
car manufacturers, supply will decrease. In all of these cases, the supply curve will move to the
left, because the quantity supplied is lower at all price levels.
| When the supply
curve shifts to the left, the equilibrium price and quantity sold will change as well. This process
is the exact opposite of the change that results from an increase in supply. As the supply curve
shifts to the left, suppliers raise their prices and the quantity demanded falls. The new equilibrium
point will be at a spot along the demand curve above and to the left of the original equilibrium
point. The market price is higher than before, and the quantity sold is
lower | | |
|
|
|
17.
|
What will happen to the supply
curve if production costs rise dramatically?
a. | Will shift to the
right | c. | Will remain
stationary | b. | Will shift to the left | d. | Will move to the right and left |
|
|
|
18.
|
What happens as the supply
curve shifts to the left?
a. | suppliers raise their prices and the
quantity demanded also rises | c. | suppliers raise their prices and the quantity demanded
falls | b. | suppliers lower their prices but there is no change in the quantity
demanded | d. | suppliers lower their prices and the
quantity demanded falls |
|
|
|
19.
|
If the market price is higher
than before, what will happen to the quantity sold
a. | will also be
higher | c. | will remain the
same | b. | will be lower | d. | market prices can never be
higher |
|
|
|
20.
|
What are some of the production
costs that can cause a shift in the supply curve? (click all that apply)
|
|
|
Shifts in
Demand
Almost every
year, around November, a
new doll or toy emerges as a nationwide
fad. People across the country
race to
stores at opening time and stand in long
lines to buy that year’s version of
Tickle
Me Elmo or Pokmon.
As you read in Chapter 4, these fads
reflect the impact of
consumer tastes and
advertising on consumer behavior. Fads
like these, in which demand rises
quickly,
are real-life examples of a rapid, rightward
shift in a market demand curve.
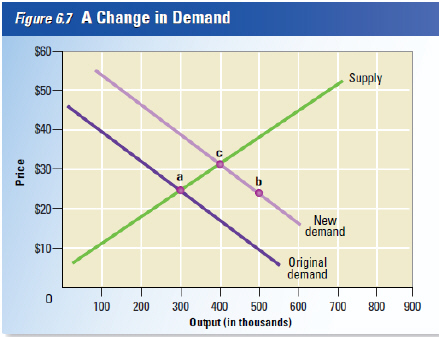
Figure
6.7 shows how a rapid, unexpected
increase in market demand will affect the
equilibrium in a
market for a hypothetical,
trendy toy.
The Problem of Excess
Demand
In Figure 6.7, the fad causes a sudden
increase in market demand, and
the
demand curve shifts to the right. This shift
leads to excess demand at the
original
price of $24 (point b). Before the fad
began, quantity demanded and
quantity
supplied were equal at 300,000 dolls,
shown at point a. On the graph,
excess
|
In the stores that carry the dolls, excess
demand appears as bare
shelves and long
lines. Excess demand also appears in the
demand appears as a gap between
the
quantity supplied of 300,000 dolls and the
new quantity demanded of 500,000 at
$24,
shown at point b. This is an increase
of 200,000 in the quantity demanded.
Economists would
also describe this as a
shortage
of 200,000 dolls.
In the stores that carry the dolls excess demand appears in the form of
search costs—the financial and opportunity costs consumers pay in searching for a good
or service. Driving to different stores and calling different towns to find an available doll are
both examples of search costs.
In the meantime, the available dolls must
be rationed, or
distributed, in some other
manner. In this case, long lines, limits on
the quantities each
customer may buy, and “first come, first serve” policies are used to
distribute the
dolls among customers.
| | |
|
|
|
21.
|
As illustrated in the chart
above an unexpected demand for a new doll will cause the demand curve to
a. | shift to the
right | c. | remain
static | b. | shift to the left | d. | be in equilibrium |
|
|
|
22.
|
In the example above, you
really want the doll in question and have to spend a great deal of time searching for it in multiple
stores. This is an example of
a. | excess supply
| c. | technological
innovation | b. | a production cost | d. | an opportunity cost |
|
|
|
23.
|
Excess demand which causes the
demand curve to shift to the right will
a. | lower
price | c. | cause price to remain the
same | b. | increase price |
|
|
|
24.
|
As the equilibrium in the chart
above shifts from a to c, output changes from
a. | $25 to
$30 | c. | 300 to
400 | b. | $5 to $55 | d. | 300 to 500 |
|
|
|
| Return to
Equilibrium
As time
passes, firms will react to the signs of excess demand and raise their prices. In fact, customers may
actually push prices up on their own if there is “bidding? ” in the market, as there is
for real estate, antiques, fine art, and hard-to find items.
If a parent cannot find the doll
he wants at the store, he might offer the store keeper an extra $5 to guarantee him a doll from the
next shipment. Through these methods, the market price will rise until the quantity supplied equals
the quantity demanded at 300,000 dolls. All of these dolls are sold at the new equilibrium price of
$30, shown at point c in Figure 6.7.
When demand increases, both the equilibrium price and the
equilibrium quantity also increase. The demand curve has shifted, and the equilibrium point has
moved, setting in motion market forces that push the price and quantity toward their new equilibrium
values. | A Fall in Demand
When a fad passes its peak, demand can fall as quickly as it rose. Excess demand turns
into excess supply for the once popular toy as parents look for a new, more trendy gift for their
children. Overflowing store shelves and silent cash registers, the symptoms of excess supply, replace
long lines and bidding wars.
When demand falls, the demand curve shifts to the left. Suppliers
respond by cutting prices on their inventory. Price and quantity sold slide down along the supply
curve to a new equilibrium point at point a in Figure 6.7. The end of the fad restores the original
price and quantity supplied.
Now that you understand economics it is time for
your generation to make some changes
 | | |
|
|
|
25.
|
As the demand curve has shifted
and the equilibrium point moves, market forces will push the price and quantity
a. | toward their new equilibrium
values | c. | to remain
static | b. | toward their new disequilibrium
value |
|
|
|
26.
|
If people suddenly loose
interest in the new doll, demand can fall quickly
a. | and supply and demand will become
frozen along the demand supply curve | c. | and excess supply can turn into excess
demand | b. | supply and demand will reach equilibrium | d. | and excess demand can turn into excess
supply |
|
|
|
27.
|
This section illustrates the
fact that suppliers
a. | react to market forces causing an
equilibrium in supply and demand | c. | react slowly to market forces that effect supply and
demand | b. | react to market forces causing a disequilibrium in supply and
demand | d. | usually ignore market forces that effect supply and
demand |
|