|
|
|
|
|
|
1.
|
Study the introduction above.
Explain what you expect to learn in this lesson. Pay close attention to the vocabulary words as you
will be tested on them later on.
|
|
|
The
market system makes certain that
consumers can buy the products they
want, that sellers make
enough profit to
stay in business, and that sellers respond to
changing needs and tastes of
consumers.
Other economic systems have been tried —
most notably, central planning
—and have
been judged by most observers to be less
successful than the market
system.
In this section we will combine our tools
for studying demand and supply to
learn
how markets operate and how markets can
turn competing interests into a
positive
outcome for both sides. In the process we
will discover that free markets
usually
produce some of their best outcomes when
they are left alone, without
government
intervention.
Balancing the
Market
Just as buyers and sellers come together in a
market, the study of demand
and supply
will come together in this section.We begin
by looking at the supply and demand
schedules.
|
As you will recall, a demand schedule
shows how much consumers are
willing to
buy at various prices. A supply schedule
shows how much sellers are willing to
sell
at various prices. Comparing these schedules should allow us to find common
ground for the
two sides of the market.
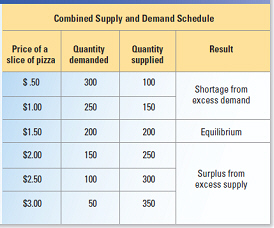
The combined supply and
demand
schedule in Figure 6.1 combines the market
demand and supply schedules for
pizza
slices that you saw in Chapters 4 and 5. For
each price, this schedule lists both
the
number of slices that consumers are willing
to buy and the number of slices that
pizzerias
are willing to supply. | | |
|
|
|
2.
|
Which economic system responds
best to the needs of consumers and businesses?
a. | central planning
system | c. | Communism | b. | market system | d. | Socialism |
|
|
|
3.
|
Market systems usually operate
best when
a. | they are given direction by the
central government | c. | they are left
alone, free of government interference | b. | they are controlled by central planners | d. | they are controlled by business |
|
|
|
4.
|
What does a demand schedule
show?
a. | how much consumers are willing to
sell at various prices | c. | how much consumers
are willing to
buy at various prices | b. | how much suppliers are willing to produce at various
prices | d. | consumption demands made by the central government
planners |
|
|
|
5.
|
What does a supply schedule
show?
a. | how much sellers are willing to
sell
at various prices. | c. | how much buyers are willing to purchase at various
prices | b. | how much sellers are willing to purchase at various
prices | d. | that there is little or no difference between supply and
demand |
|
|
|
6.
|
What does the Supply and Demand
schedule above show?
a. | the number of slices that consumers
are willing to buy and the number of slices that pizzerias are willing to supply at different
production costs | c. | demand is the same
at each price | b. | there is little difference between supply and
demand | d. | the number of slices that consumers are willing to buy and
the number of slices that pizzerias are willing to supply at each
price. |
|
|
|
 | Defining
Equilibrium
The
point where demand and supply come
together at the same number of slices is
called the
equilibrium. Equilibrium is the
point of balance between price and
quantity. At equilibrium,
the market for a
good is stable.
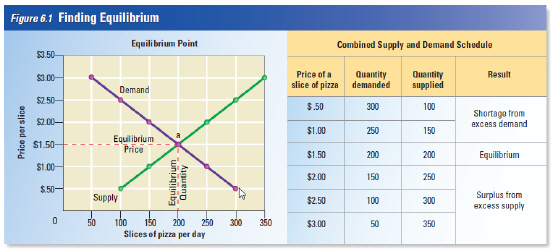
To find the equilibrium price and equilibrium
quantity,
simply look for the price
at which the quantity supplied equals the
quantity demanded. Do you
see that in
Figure 6.1 this occurs at a price of $1.50
per slice? At that price, and only at
that
price, the quantity demanded and the
quantity supplied are equal, at 200 slices
per
day. This is the market equilibrium.
| In the market
for pizza, as in any
market, quantities supplied and demanded
will be equal at only one price
and one
quantity. At this equilibrium price, buyers
will purchase exactly as much of
the
product as firms are willing to sell. Buyers
who are willing to purchase the goods
at
the equilibrium price will find ample
supplies on store shelves. Firms that are
willing
to sell at the equilibrium price will
find enough buyers for their goods.
Graphing
Equilibrium
We can also illustrate equilibrium with a
supply and demand graph.
In Figure 6.1,
we have plotted on the same graph the
market supply curve and the
market
demand curve for slices of pizza. The equilibrium price and quantity can be found
where
quantity supplied equals quantity demanded, or the point where the supply
curve crosses the demand
curve. On the
graph, this is point a. | | |
|
|
|
7.
|
Where is equilibrium on the
chart above?
a. | the point where supply is greater
than demand | c. | the point where
demand is greater than supply | b. | the point where supply and demand intersect | d. | the point where a slice of pizza costs
$0.00 |
|
|
|
8.
|
What is the equilibrium price
for a slice of pizza?
a. | $.50 | c. | $1.50 | b. | $1.00 | d. | $2.00 |
|
|
|
9.
|
Assume you own the pizzaria
illustrated in figure 6.1 At what price per slice of pizza will you loose the most money?
a. | $.50 | c. | $3.00 | b. | $1.50 | d. | you will not loose money at any
price |
|
|
|
10.
|
The pizzaria will incur the
greatest losses by having
a. | excess
supply | c. | excess
price | b. | excess demand | d. | equilibrium |
|
|
|
11.
|
Market equilibrium will be
found at the price at which the quantity demanded is equal to
the quantity ____________
.
a. | priced | c. | demanded | b. | cost | d. | supplied. |
|
|
|
12.
|
Which market curves are illustrated in the chart above?
(pick 2)
|
|
|
 | Disequilibrium
If the market price or quantity supplied is
anywhere but at the equilibrium, the market is in a state that economists call disequilibrium.
Disequilibrium occurs when quantity supplied is not equal to quantity demanded in a market. In the
example, disequilibrium will occur with any price other than $1.50 per slice or any quantity other
than 200 slices. Disequilibrium can produce one of two outcomes, excess demand or excess
supply. | |
|
|
|
13.
|
If the market price or quantity
supplied is not at the equilibrium point, the market is in a state that economists call
_____________.
a. | equilibrium | c. | disarray | b. | disequilibrium | d. | confusion |
|
|
|
14.
|
If supply is 250 and price is
$2.00, what market condition will exist?
a. | excess
supply | c. | market
equilibrium | b. | excess demand | d. | market balance |
|
|
|
15.
|
If price per slice is $1.00 and
demand is 250 slices, what market condition will exist?
a. | market
balance | c. | excess
supply | b. | market equilibrium | d. | excess demand |
|
|
|
16.
|
If price is $1.50 and demand is
200 slices, what market condition will exist?
a. | equilibrium | c. | excess supply | b. | disequilibrium | d. | excess demand |
|
|
|
Excess
Demand
The problem
of excess demand occurs when quantity demanded is more than quantity supplied. When the actual price
in a market is below the equilibrium price, you have excess demand, because a low price encourages
buyers and discourages sellers.
For example, in
Figure 6.1, a price of $1.00 per slice of pizza will lead to a quantity demanded of 250 slices per
day and a quantity supplied of only 150 slices per day. At this price, there is excess demand of 100
slices per day.
| |
|
|
|
17.
|
If Fillippi’s Pizza
raises the price of a slice of pizza from $1.00 to $2.50, how many slices will it have to throw away
each day?
a. | 100 | c. | 50 | b. | 200 | d. | will not have to throw any away |
|
|
|
18.
|
What is the effect of excess
demand? (pick 2)
|
|
|
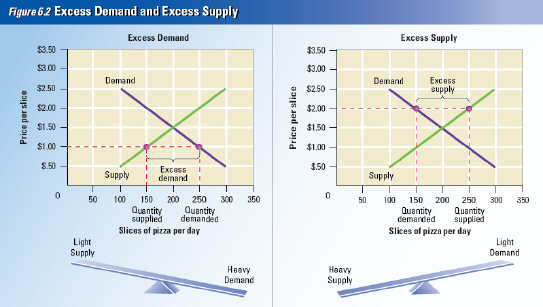
| When
customers want to buy 100 more slices of pizza than restaurants are prepared to sell, these customers
will have to wait in long lines for their pizza, and some will have to do without. In Figure 6.2,
above, we have illustrated the excess demand at $1.00 per slice by drawing a dotted line across the
graph at that price. As you can see, at $1.00 a slice, the quantity demanded is 250 slices, and the
quantity supplied is 150 slices.
If you were running the pizzeria, and you noticed long
lines of customers waiting to buy your pizza at $1.00 per slice, what would you do? Assuming that you
like to earn profits, you would probably raise the price. As you increased the price of pizza, you
would be willing to work harder and bake more, because you would know you could earn more money for
each slice you sell.
| Of
course, as the price rises, customers will buy less pizza, since it is becoming relatively more
expensive. When the price reaches $1.50 per slice, you will find that you are earning more profits
and can keep up with demand, but the lines are much shorter. Some days you may throw out a few
leftover slices, and other days you have to throw an extra pizza or two in the oven to keep up with
customers, but on the whole, you are meeting the needs of your customers. In other words, the market
is now at equilibrium.
As long as there is excess demand, and
the quantity demanded exceeds
the quantity
supplied, suppliers will keep raising the
price. When the price has risen enough
to
close the gap, suppliers will have found the highest price that the market will bear.
They
will continue to sell at that price until
one of the factors described in Chapter 4 or
5
changes the demand or supply curve and
creates new pressures to raise or lower
prices, and
eventually, a new equilibrium. | | |
|
|
|
19.
|
When customers have to wait in
long lines to purchase a slice of pizza, it illustrates that a state of __________
exists
a. | equilibrium | c. | excess demand | b. | profitability | d. | excess supply |
|
|
|
20.
|
What would motivate a pizza
store owner to raise prices?
a. | excess
supply | c. | equilibrium between supply and
demand | b. | excess demand | d. | state of anarchy |
|
|
|
21.
|
As a store owner raises the
price of a slice of pizza, what will be the likely effect?
a. | more supply and
demand | c. | more supply and less
demand | b. | less supply and demand | d. | more demand and less supply |
|
|
|
22.
|
A store owner who is selling
pizza slices for $.50 a slice will likely have to _____ prices to reach
equilibrium.
a. | lower | c. | continue the same | b. | raise | d. | disequilibrium |
|
|
|
Excess
Supply
If the price
is too high, then the market
will face a problem of excess supply.
Excess supply occurs
when quantity
supplied exceeds quantity demanded. For
example, at a price of $2.00 per slice
of
pizza, the quantity supplied of 250 slices
per day is much greater than the
quantity
demanded of 150 slices per day. This
means that pizzeria owners will be making
100
more slices of pizza each day than
they can sell at that price. The relatively
high price
encourages pizzeria owners to
work hard and bake lots of pizza, but it
discourages customers
from buying pizza,
since it is relatively more expensive than other menu items. Some customers
will
buy one slice instead of two, while others
will eat elsewhere. The problem is
shown
graphically in Figure 6.2. At the end of the
day, it is likely that 100 slices will have
to
be thrown out.
| After a short time, pizzeria owners will
get tired of
throwing out unsold pizza at
closing time and will cut their prices. As the
price falls, the
quantity demanded will rise,
and more customers will buy more pizza.
At the same time, pizzeria
owners will
prepare fewer pizzas. As the price of pizza
falls, the quantity demanded rises and
the
quantity supplied falls. This process will
continue until the price reaches $1.50
per
slice. At that price, the amount of pizza
that pizzeria owners are willing to sell
is
exactly equal to the amount that their
customers are willing to buy.
Whenever the
market is in disequilibrium
and prices are flexible, market forces will
push the market toward
the equilibrium.
Sellers do not like to waste their resources on
excess supply, particularly
when the goods
cannot be stored for long, like pizza. And
when there is excess demand,
profit-seeking
sellers realize that they can raise prices to
earn more profits. In this way,
market prices
move toward the equilibrium level. | | |
|
|
|
23.
|
In which type of economy are
you most likely to reach a state of equilibrium between supply and demand?
a. | socialist economy where pizza is
free and prices are fixed | c. | centrally planned economy with fixed prices | b. | free market with flexible
prices | d. | communist economy with little or no
supply |
|
|
|
24.
|
Markets tend to move
toward
a. | excess
supply | c. | equilibrium | b. | excess demand | d. | disequilibrium |
|
|
|
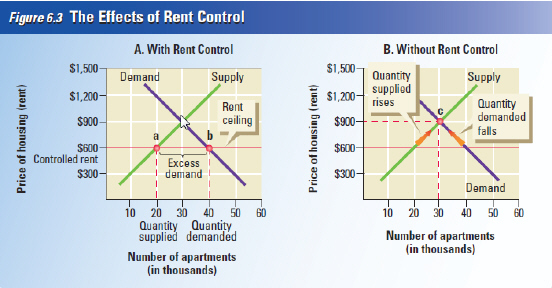
| Government
Intervention
Markets tend toward equilibrium, but in
some cases the
government steps in to control prices. The government can impose a price ceiling, or a maximum
price that can be legally charged for a good. In other cases, the government can create a price
floor, or a minimum price for a good or service.
Price
Ceilings
A price ceiling is a maximum price, set by law, that sellers can charge for a
good or service. The government places price ceilings on some goods that are considered
“essential” and might become too expensive for some consumers. For example, some local
governments, notably New York City, have experimented with ceilings on apartment rents, called
rent control. Rent control was introduced to prevent inflation during a housing crisis in the
early 1940s and continued after World War II. More recently, other cities imposed rent control, often
motivated by a desire to help poor households by cutting their housing costs and permitting them to
live in neighborhoods they could otherwise not afford. As we’ll see, rent control reduces the
quantity and quality of housing, so it helps some households but harms others, including many poor
households. If the ceiling is established below the equilibrium price, the result will look like
graph A in Figure 6.3 above.
| In this
market, the supply and demand curves for two-bedroom apartments meet at the equilibrium shown at
point c in graph B. At this point, rents are $900 a month. Consumers will demand 30,000 apartments
and suppliers will offer 30,000 apartments for rent.
Suppose that the city government passes a
law that limits the rent on two-bedroom apartments to $600 per month. At that price, the quantity of
apartments demanded is 40,000 (point b), and the quantity supplied is 20,000 (point a). At such a low
price, apartments seem inexpensive, and many people will try to rent apartments instead of living
with their families or investing in their own houses.
However, some landlords will have
difficulty earning profits or breaking even at these low rents. Fewer new apartment buildings will be
built, and older ones might be converted into offices, stores, or condominiums.
As you can see
in graph A of Figure 6.3, the result is excess demand of 20,000 apartments. The price ceiling
increases the quantity demanded but decreases the quantity supplied. Since rents are not allowed to
rise, this excess demand will last as long as the price ceiling holds. | | |
|
|
|
25.
|
If the government imposes rent
control on apartments, what will be the effect?
a. | more apartments will be
available | c. | apartments will be
more expensive | b. | fewer apartments will be available | d. | people will invest more time and effort taking care of their
apartments |
|
|
|
26.
|
Without rent control (pick
3)
|
|
|
27.
|
With rent control (pick
3)
|
|
|
The Cost of
Price Ceilings
When the
price cannot rise to the equilibrium
level, the market must determine
which 20,000 of the
40,000 households
will get an apartment, and which 20,000
will do without. Although
governments
usually pass rent control laws to help
renters with the greatest need, few of
these
renters benefit from rent control. Methods
besides prices, including long waiting
lists,
discrimination by landlords, and even
bribery, are used to allocate the scarce
supply
of apartments among the many
people who want them. Luck becomes an
important factor, and
sometimes the only
way to get a rent-controlled apartment is to
inherit it from a parent or
grandparent.
New York City revised its laws in the
1990s to exclude the wealthiest renters
from rent control protection after newspapers
discovered that some very wealthy
people rented
spacious apartments at prices
much less than market value.
| Additionally,
since the rent controls limit
landlords’ profits, landlords may try to
increase their
income by cutting costs. Why
should a landlord give a building a fresh
coat of paint and a new
garden if he or she
can’t earn the money back through higher
rent? Besides, if
there’s a waiting list to get
an apartment, the landlord has no incentive
to work hard
and attract renters. As a result,
many rent-controlled apartment buildings
become run-down, and
renters may have to
wait months to have routine problems fixed.
 | | |
|
|
|
28.
|
Which group of people would
most likely be against rent
controls
a. | free market
capitalists | c. | central planning
advocates | b. | socialists | d. | communists |
|
|
|
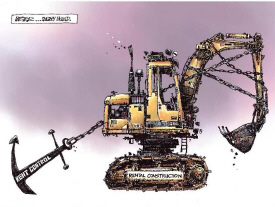
29.
|
What does the cartoon above
mean?
a. | Rent control prevents construction
companies from destroying housing | c. | Rent control encourages the construction of new
housing | b. | Construction companies are bad for the
economy | d. | Rent control inhibits the construction of new
housing |
|
|
|
Ending Rent
Control
If rents
were allowed to rise to the market equilibrium level, which is $900 per month, the quantity of
apartments in the market would actually rise to 30,000 apartments. The market would be in
equilibrium, and people who could afford $900 a month would have an easier time finding vacant
apartments. Instead of spending time and money searching for apartments, and then having to accept an
apartment in a poorly maintained building, many renters would be able to find a wider selection of
apartments. Landlords would also have a greater incentive to properly maintain their buildings and
invest in new construction.
| On the other hand, people lucky enough to live in a
rent-controlled apartment may no longer be able to afford to stay there once rent control is ended
and the landlord can legally raise the rent. As soon as the neighborhood improves, these renters may
be priced out of their own apartments, to be replaced by people willing to pay the equilibrium price.
Remember that ending rent control increases the number of apartments on the market by
10,000.
Certainly, the end of rent control benefits
some people and hurts others.
Economists
agree that the benefits of ending rent
control exceed the costs, and suggest
that
there are better ways to help poor households
find affordable
housing. | | |
|
|
|
30.
|
Ending rent control would
result in
a. | more available apartments
| c. | market
disequelibrium | b. | fewer available apartments | d. | cheaper apartments |
|
|
|
31.
|
If you were living in a rent
control apartment and rent control was suddenly ended, the result would most likely
be
a. | less demand for your apartment and a
decrease in the rent you are paying | c. | market disequilibrium | b. | greater demand for your apartment and an increase in the
rent you are paying | d. | more run-down
neighborhoods |
|
|
|
a. | equilibrium | e. | disequilibrium | b. | rent control | f. | minimum wage | c. | excess supply | g. | excess demand | d. | price ceiling | h. | price floor |
|
|
|
32.
|
when quantity supplied is more
than quantity demanded
|
|
|
33.
|
the point at which quantity
demanded and quantity supplied are equal
|
|
|
34.
|
when quantity demanded is more
than quantity supplied
|
|
|
35.
|
a maximum price that can be
legally charged for a good or service
|
|
|
36.
|
describes any price or
quantity not at equilibrium; when quantity supplied is not equal to quantity demanded in a
market
|
|
|
37.
|
a price ceiling placed on rent
|
|
|
38.
|
a minimum price for a good or
service
|
|
|
39.
|
a minimum price that an
employer can pay a worker for an hour of labor.
|