|
|
|
|
|
|
1.
|
Study the introduction above.
Explain what you expect to learn from this lesson. Also, pay attention to the vocabulary words as you
work through this assignment. You will be tested on the vocab words.
|
|
|
In
Chapter 2, you read about economic
systems, which are different ways of
answering the
three economic questions of
what to produce, how much to produce,
and who gets what.
In the United States,
most goods are allocated through a market
system. In a market system,
the interaction
of buyers and sellers determines the prices
of most goods as well as what
quantity of a
good will be produced. Buyers demand
goods, sellers supply those goods, and
the
interactions between the two groups lead
to an agreement on the price and the
quantity
traded.
| Demand is the desire to own something
and the ability to pay for it. We will look at
the
demand side of markets in this chapter.
In the next chapter we will look at the
actions of
sellers, which economists call the
supply side. In Chapter 6, we will look at
supply and demand
together and study
how they interact to establish the prices
that we pay for most
goods. | | |
|
|
|
2.
|
How are goods alocated in the
United States
a. | Presidential
directives | c. | government
planning | b. | the market system | d. | congressional action |
|
|
|
3.
|
What is the interaction of
buyers and sellers to determine the price of products and what is going to be
produced?
a. | the socialist
model | c. | the market
system | b. | the budget system | d. | central planning |
|
|
|
4.
|
You want a new cell phone and
since you just got $500 for your birthday, you are happy that you can make the purchase. What is this
called?
a. | supply | c. | a budget | b. | demand | d. | greed |
|
|
|
The Law of
Demand
Anyone who has ever
spent money will easily understand the law of demand. The law of demand says that when a good’s price is lower,
consumers will buy more of it. When the price is higher, consumers will buy less of it. All of us act
out this law of demand in our everyday purchasing decisions. Whether your income is $10 or $10
million, the price of a good will strongly influence your decision to buy.
Ask yourself this
question: Would you buy a slice of pizza for lunch if it cost $1 Many of us would, and some of us
might even buy more than one slice. But would you buy the same slice of pizza if it cost $2 Fewer of
us would buy it at that price. Even real pizza lovers might reduce their consumption from 3 or 4
slices to just 1 or 2. How many of us would buy a slice for $10 Probably very few. As the price of
pizza gets higher and higher, fewer of us are willing to buy it. That is the law of demand in
action.
|
The law of demand is the result of not one pattern of behavior, but of two
separate patterns that overlap. These two behavior patterns are the substitution effect and the income effect.
The substitution effect and income effect describe two different ways that a consumer can change his
or her spending patterns. Together, they explain why an increase in price decreases the quantity
purchased. Figure 4.2 describes how the substitution effect and the income effect can change a
consumer’s buying habits. | | |
|
|
|
5.
|
What is the law of
demend?
a. | whan the price of a good or service
is low people tend to buy more of them | c. | when the supply of a good or service is low people tend to buy more of
them | b. | when the price of a good or service is high people tend to buy more of
them | d. | when the supply of a good or service is high people tend
to buymore of them |
|
|
|
6.
|
You own a Philly cheese steak
restaurant. You decide to raise the price of a sandwich from $5.00 to $6.00, According to the law of
demand, what can you expect to happen to your sales?
a. | You will sell more steak
sandwiches | c. | Sandwich sales
will stay about the same | b. | You will sell fewer steak sanwiches | d. | You will sell fewer steak sandwiches but make more money
|
|
|
|
7.
|
You own a shoe store. You
steadily increase your prices a little bit at a time until the price of a pair of shoes is much
higher. According to the law of demand, what can you expect to happen.
a. | you will sell fewer shoes but make
more money | c. | you will sell more
shoes | b. | you will sell fewer shoes | d. | sales will remain constant |
|
|
|
8.
|
Which two things
explain why an increase in price
decreases the quantity purchased? (pick two)
|
|
|
|
|
|
9.
|
What does the graphic above
illustrate?
a. | cheap people eat more
pizza | c. | the effect of demand on
price | b. | girls like guys who eat pizza | d. | the effect of price on demand |
|
|
|
The Substitution
Effect
When the price of pizza
rises, pizza
becomes more expensive compared to
other foods, such as tacos and salads. So,
as
the price of a slice of pizza rises, consumers
have an incentive to buy one of those
alternatives as a substitute for pizza. This causes a drop in the amount of pizza demanded. For
example, instead of eating pizza for lunch on Mondays and Fridays, a student could eat pizza on
Mondays and a bagel on Fridays. This change in spending is known as the substitution effect. The
substitution effect takes place when a consumer reacts to a rise in the price of one good by
consuming less of that good and more of a substitute good.
|
The substitution effect can also apply
to
a drop in prices. If the price of pizza drops,
pizza becomes cheaper compared to
other
alternatives. Consumers will now substitute
pizza for tacos, salads, and other
lunch
choices, causing the quantity of pizza
demanded to rise. | | |
|
|
|
10.
|
Which situation below is an
example of the substitution effect?
a. | KFC keeps raising their prices so
you stop eating | c. | KFC keeps raising
their prices so you eat more often at Jack in the Box | b. | KFC keeps raising their prices so you decide to eat fewer
calories each day | d. | KFC keeps raising their prices so
you stop buying your heart medication |
|
|
|
11.
|
According to the Substitution
Effect, what is likely to happen if KFC lowers their prices?
a. | You will buy more
KFC | c. | You will eat more often at
McDonalds | b. | You will buy less KFC | d. | You will eat more chicken
McNuggets |
|
|
|
The Income
Effect
Rising prices have
another effect that we
have all felt. They make us feel poorer. When
the price of movie
tickets, shoes, or pizza
increases, your limited budget just won’t buy
as much as it used
to. It feels as if you have
less money. You can no longer afford to buy
the same combination of
goods, and you
must cut back your purchases of some
goods. If you buy fewer slices of
pizza
without increasing your purchases of other
foods, that is the income
effect.
| One important fact to remember is that
economists measure consumption in
the
amount of a good that is bought, not the
amount of money spent to buy it. Although
you
are spending more on pizza, you are
consuming fewer slices, so your consumption
has gone down.
If the price rises from
$1 a slice to $2 a slice, you may decide to
pay extra and order your
usual lunch, but
you certainly would not choose to buy
more slices than before. Although
people
spend more of their money on pizza, when the price goes up, the quantity demanded
goes
down. In this sense, the income effect
leads to the law of demand.
Remember, too, that the
income effect
also operates when the price is lowered. If
the price of pizza falls, all of a
sudden you
feel wealthier. If as a result you buy more
pizza, that’s the income
effect. | | |
|
|
|
12.
|
Which is an example of the
income effect?
a. | KFC raises prices so you buy less
KFC and more McDonalds | c. | McDonalds raises
prices so you but more KFC | b. | KFC raises prices so you stop buying KFC | d. | McDonalds raises prices so you but less
KFC |
|
|
|
13.
|
The Income Effect depends
on
a. | the price of an
obnect | c. | how much money you
make | b. | the quantity produced | d. | the quantity consumed |
|
|
|
Both the substitution effect and the income effect lead
consumers to buy less of good A when it becomes more expensive. However, the income effect leads
consumers to spend less on other goods so they can afford good A, while the substitution effect
encourages consumers to replace expensive good A with other, less expensive
substitutes.
|
|
|
14.
|
Look at the graphic above. What
will the substitution effect and the
income effect lead consumers to do when the price of good A increases?
a. | the substitution effect and the
income effect will cancel each other out | c. | consumers will buy more of it | b. | consumers will buy less of
it | d. | consumtion will not be
effected |
|
|
|
15.
|
Look at the chart above. If the
price of product A increases what will the substitution effect be on the consumption of other
goods?
a. | will
increase | c. | will remain the
same | b. | will decrese | d. | will increase and decrease |
|
|
|
A Demand
Schedule
The law of demand
explains how the price
of any item affects the quantity demanded
of that item. Before we look
at the relationship
between price and quantity
demanded for a specific good, we need to
look
more closely at how economists use
the word demand.
Understanding
Demand
To have demand for a good, you must be
willing and able to buy it at the
specified
price. This means that you want the good,
and you can afford to buy it. You
may
desperately want a new car, a laptop | computer, or a trip to Alaska, but if
you
can’t truly afford any of these goods, then
you do not demand them. You
might
demand compact discs, though, if at the
current price you have enough money and
want
to buy some.
A demand
schedule is a table that lists
the quantity of a good that a person will
purchase at each
price in a market. For
example, the table on the left in Figure 4.3
illustrates individual
“demand for pizza.”
The schedule shows specific quantities that
a student named
Ashley is willing and able
to purchase at specific prices. For example,
at a price of $2.00,
Ashley’s “quantity
demanded” of pizza is two slices per
day. | | |
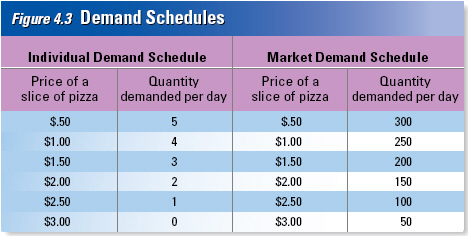
Demand schedules show that demand for a
good falls as the price rises.
|
|
|
16.
|
How does the market demand
for pizza change when the price falls from $2.50 to $1.00 a slice?
a. | decreases | c. | increases | b. | stays the same | d. | increases and decreases |
|
|
|
17.
|
You want to purchase a new I
phone but you just don’t have the money to buy it.
a. | Economists call this
demand | c. | Economists would call this
supply | b. | Economist would not call this demand | d. | Economist would call this supply and
demand |
|
|
|
18.
|
Look at the Demand Schedule
above. If the price of a slice of pizza is $1.00, Mr Schneemann is likely to eat 4 slices a day. How
many slices is he likely to eat if the price increases to $2.00 a slice?
|
|
|
Market Demand
Schedules
If you owned a store,
knowing the demand
schedule of one customer might not be very
helpful. You would want to know
how customers as a whole would react to price
changes. When you add up the demand
schedules of
every buyer in the market, you
can create a market demand schedule. A
market demand schedule shows the quantities
demanded at each price by all consumers in the market. A market demand schedule for pizza would allow
a restaurant owner to predict the total sales of pizza at several different prices.
The owner
of a pizzeria could create a
market demand schedule for pizza slices by
surveying his or her
customers and then
. | adding up the quantities demanded by all
individual consumers at each
price. The
resulting market demand schedule will look
like Ashley? ’s demand schedule,
but the quantities will be larger, as shown in Figure 4.3
Note that the market demand
schedule
on the right in Figure 4.3 contains the same
prices as Ashley? ’s individual
demand
schedule, since those are the possible prices
that may be charged by the pizzeria.
The
schedule also exhibits the law of demand.
At higher prices the quantity demanded
is
lower. The only difference between the two
demand schedules is that the market
schedule
lists larger quantities demanded.
This is the case, since now we are talking
about the purchase
decisions of all
potential
consumers in the market. | | |
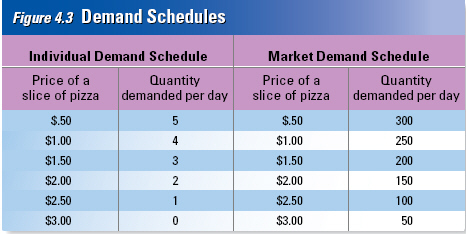
Demand schedules show that demand for a good falls as the price
rises.
|
|
|
19.
|
You own a pizza shop. You
increase the price of a slice a pizza from $.50 to $2.50. How will this effect demand.
a. | There willbe 200 fewer slices
demanded | c. | There will be 50
more slices demanded | b. | There will be 200 more sliced demanded | d. | There will be little or no effect on
demand |
|
|
|
20.
|
How does the market demand for
pizza change when the price falls from $2.50 to $1.00 a slice?
a. | quantity demanded increaes by 250
slices | c. | quantity demended decreases by 150
slcies | b. | quantity demanded decreades by 250 slices | d. | quantity demanded increases by 150
slices |
|
|
|
21.
|
If you own a business, which
demand schedule are you likely to use?
a. | individual demand
schedule | c. | individual supply
schedule | b. | market demand schedule | d. | market supply schedule |
|
|
|
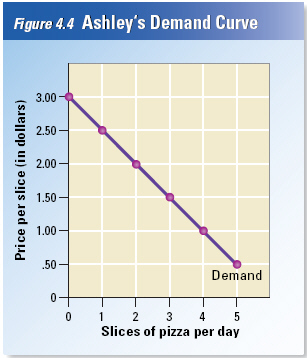
The Demand
Graph
What if you took the
numbers in Ashley’s demand schedule in Figure 4.3 and plotted them on a graph? The result would
be a demand curve. A demand
curve is a graphic representation of a demand schedule.
How do economists create a demand
curve? When they transfer numbers from a demand schedule to a graph, they always label the vertical
axis with the lowest possible prices at the bottom and the highest at the top. Likewise, they always
label the quantities demanded on the horizontal axis with the lowest possible quantity at the left
and the highest possible quantity at the right. As Figure 4.4 shows, each pair of price and
quantity-demanded numbers on the schedule is plotted as a point on the graph. Connecting the points
creates a demand curve. |
 | | |
|
|
|
22.
|
How many slices per day is
Ashley likely to consume at $1.50 a slice?
|
|
|
23.
|
Which axis in the chart above
shows demand?
a. | left Y
axis | c. | top w
axis | b. | right z axis | d. | bottom x axis |
|
|
|
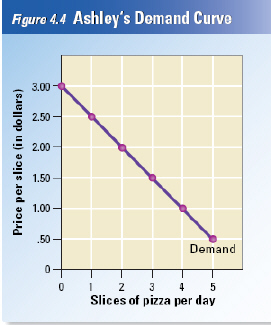 |  | | |
Reading a Demand Curve
Note two facts about the graph shown in
Figure 4.4.
First, the graph shows only the
relationship between the price of this good
and the quantity
that Ashley will purchase.
It assumes that all other factors that would
affect Ashley’s
demand for pizza—like the
price of other goods, her income, and the
quality of the
pizza—are held constant.
Second, the demand curve on the graph
slopes downward to the
right. If you follow
the curve with your finger from the top left to the bottom right, you will
notice that as
price decreases, the quantity demanded
increases. This is just another way
of
stating the law of demand, which states
that higher prices will always lead to
lower
quantities demanded. All demand schedules
and curves reflect the law of
demand.
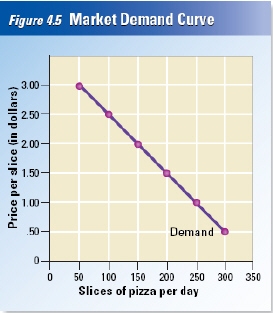
| The demand curve in Figure 4.4 shows
Ashley’s demand for slices of
pizza. A
market demand curve shows the quantities
demanded by all consumers at the
same
prices. Thus, in Figure 4.5, the prices listed
on the vertical axis are identical to those
in
Ashley? ’s demand curve. The quantities
listed on the horizontal axis are
much
larger, corresponding to those in the
market demand schedule in Figure
4.3.
| | |
|
|
|
24.
|
In the real world many factors
effect how many slices are likely to be consumed. Are people concerned about their weight, do they
make enough money that price is not important, do they prefer Mexican food over Italian food. The
charts above only consider two things. What are they?
|
|
|
Limits of a Demand
Curve
The market demand
curve can be used to
predict how people will change their
buying habits when the price of a
good
rises or falls. For example, if the price of
pizza is $1.50 a slice, the pizzeria will
sell
200 slices a day.
| This market demand curve is only
accurate for one very
specific set of market
conditions. If a nearby factory were to
close, so that fewer people were
in the area
at lunchtime, the pizzeria would sell less
pizza even if the price stayed the same.
In
the next section, you will read about how
demand curves can shift because of changes
in
factors other than price. | | |
|
|
|
25.
|
The demand curve only measures
one specific thing. What is it?
a. | how demand effects
price | c. | how individuals effect
demand | b. | how price effects demand | d. | how markets effect demand |
|
|
|
a. | income
effect | e. | law of
demand | b. | demand schedule | f. | market demandschedule | c. | demand | g. | substitution effect | d. | demand curve |
|
|
|
26.
|
a graphic representation of a
demand schedule
|
|
|
27.
|
a table that lists the quantity of a good all consumers in
a market will buy at each different price
|
|
|
28.
|
the desire to own something and the ability to pay for
it
|
|
|
29.
|
a table that lists the quantity of a good a person will
buy at each different price
|
|
|
30.
|
when consumers react to an
increase in a good? ’s price by consuming less of that good and more of other
goods
|
|
|
31.
|
the change in consumption resulting from a change in real
income
|
|
|
32.
|
consumers buy more of a good
when its price decreases and less when its price increases
|